TRANSLOCATION OF NUTRIENTS IN THE PHLOEM: DIXON'S PARADOX
Introduction: Plant phloem consists mainly of living cells called seive tubes that carry food in the form of carbon from their sources such as leaves to sinks such as roots. In the early 1920's, scientists attempted to quantify the flow of carbon in plants in order to understand the mechanisms behind transport. Proponents of mass transport believed the high carbon concentration near the leaves and the low concentration near sinks would set up a pressure gradient along the entire length of the plant that could drive the flow of nutrients. In other words, along the length of the plant the concentration of carbon increases very slightly every few micrometers. These slight changes would be enough to drive nutrient flow.
Importance: Simple equations can be used to describe the mechanisms behind transport of nutrients through sieve tubes. Experimental data can then be compared with expected results of the equations to see if the theorized mechanisms make sense in the natural world.
Question: How does sap concentration in the phloem affect the rate of transport? Is the pressure gradient created by the difference in solute concentration at sources and sinks strong enough to drive the flow of nutrients?
Variables:
|
M |
mass transfer of carbon per unit area (g/cm3sec) |
|
C |
concentration gradient of sap (g/cm4) |
|
s |
speed of flow (cm/sec) |
Methods: Dixon attempted to quantify the flow of carbon by assuming the mass transfer of carbon per unit area (M) was directly proportional to the concentration gradient of sap (C) over a short distance, and the speed of flow (s):
M = C x s
Using typical values for M and C, Dixon calculated the speed of sap within the phloem would have to be from 50 to 100 cm per hour in order to drive nutrient flow. This seemed highly unlikely due to the small size of seive tubes. Also, seive plates connect neighboring cells and act to interrupt carbon flow.
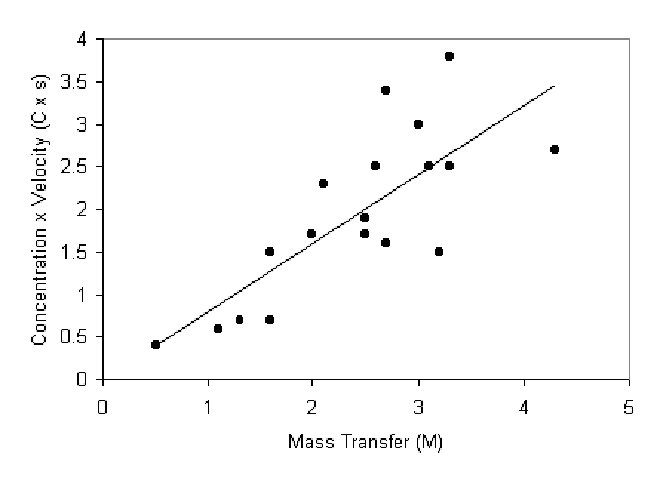
In the 1970's, Grange and Peel substantiated the usefulness of this equation by measuring all three values in willow trees (M, C, and s). They plotted Cs as a function of M. If Dixon's equation is reliable, then we expect to see a line with a slope of 1.
Interpretation: Grange and Peel found a good correlation (r = 0.76) when they graphed their measured C x s versus M. The plotted data fell slightly below the 45° line expected for a slope of 1.
Conclusion: Although Dixon's equation seemed unreliable because of the high speeds necessary for transport, experimental data seemed to substantiate his equation. Although the concentration gradient of carbon from cell to cell was quite low, speeds of flow seemed to be high enough to support the flow of nutrients.
Additional Questions:
1. For a plant with a speed of sap flow (s) of 100 cm per hour and a mass transport (M) of 3.0 g per cm2 per hour, what concentration of carbon (C) is necessary to maintain mass transport? If the concentration gradient over a short distance in this plant is only 0.01 g per cm3, does Dixon's equation make sense?
Sources: M. J. Canny. 1984. Translocation of nutrients and hormones, p. 277-296 in Advanced Plant Physiology. M. B. Wilkins, ed. Pitman Publishing Limited, Marshfield, MA
Grange, R. I. and A. J. Peel. 1978. Evidence for solution flow in the phloem of willow. Planta 138:15-23
Copyright 1999 M. Beals, L. Gross, S. Harrell